
Market Segmentation Bexar County Commissioner Precinct 01
BCCP01 Precinct-Level Voting Trends

This is TBC’s analysis of the upcoming 2026 gubernatorial election. The analysis will examine trends at various levels to arrive at a data-driven campaign strategy and targeting model. The objectives of the study are to affect (increase) voting margins across the county through an efficient targeting model and contribute to building a foundation to enhance Republican competitiveness in the future. Obviously, a study, in-and-of-itself, produces nothing; it simply lays out the case for achieving those objectives. The objectives will only be realized if (1) underlying analysis is correct and relevant; (2) strategies are sound and workable; and (3) if they are implemented from the precinct level upward. Every element of the conservative movement from local activists (precinct chairs) to candidates to donors to party officials must do their part to bring about victory.
Market Segments
We begin with Bexar County Commissioner Precinct 01 Gubernatorial Election Results for 2022 as a baseline for the study. Chart 1.1 plots 2022 Total Republican General Election Ballots (TRBCg) on the y-axis against Total Republican Primary Ballots Cast (TRPBCp) on the x-axis. Each point appears as a precinct in Bexar County Commissioner Precinct 01. A linear regression line is fitted to test how well primary turnout predicts general-election Republican turnout.
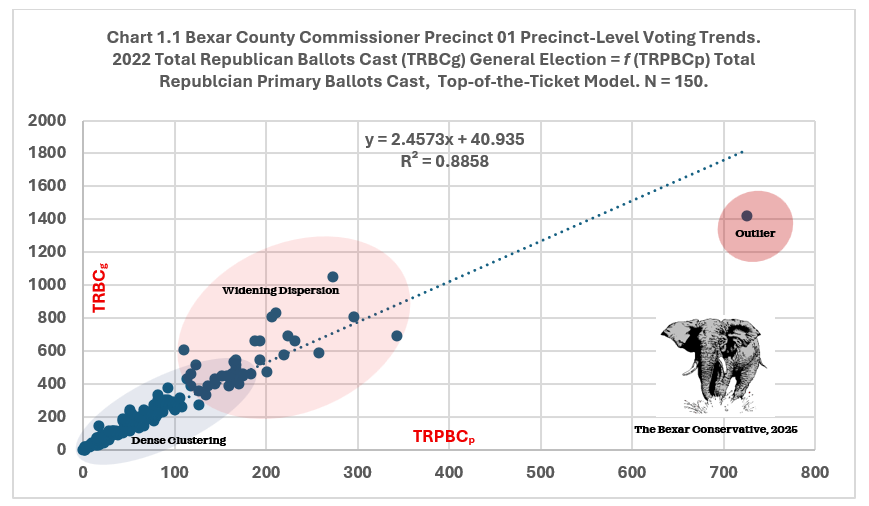
Regression analysis demonstrates a strong linear relationship between 2022 Total Republican Primary Ballots Cast (TRPBCp) - precinct-level voting – to Total Republican Ballots Cast (TRBCg) in Gubernatorial Election. R2 = means about 89% of the variation in Republican general-election ballots cast can be explained by Republican primary turnout. The slope = 2.4573 means that on average each additional TRPBCp corresponds to ~2.46 general-election ballots. This is intuitive because primaries capture only the most engaged partisan voters, while generals pull in many more occasional or crossover voters. The slope tells us much about voter efficiency, that is, the conversion of Republican votes.
Dense clustering at low values demonstrates that most precincts have low primary and general turnout but still follow trend. A few high-turnout precincts – large precincts - sit far to the right and top, but still roughly align with the regression, reinforcing the model’s strength. There are also precincts that moderate around the line over- or under-perform relative to the trend, suggesting local variation (competitiveness, candidate effects, demographics).
Republican primary turnout is an excellent proxy for precinct-level Republican general-election performance. Deviations from the line are analytically interesting. Precincts tracking above trend are where Republicans expanded well beyond their primary base (higher conversion). Precincts below trend demonstrate Republican failure to convert primary enthusiasm into general-election turnout. This chart provides strong empirical support that Republican general-election performance scales predictably with primary engagement, making TRPBCp a strong baseline variable for turnout modeling, anomaly detection, or (as TBC’s earlier work suggests) friction or conversion indices.
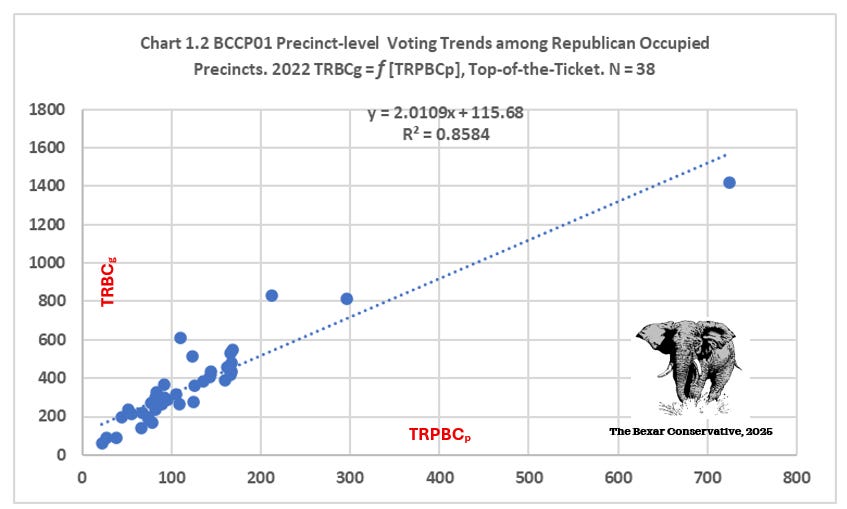
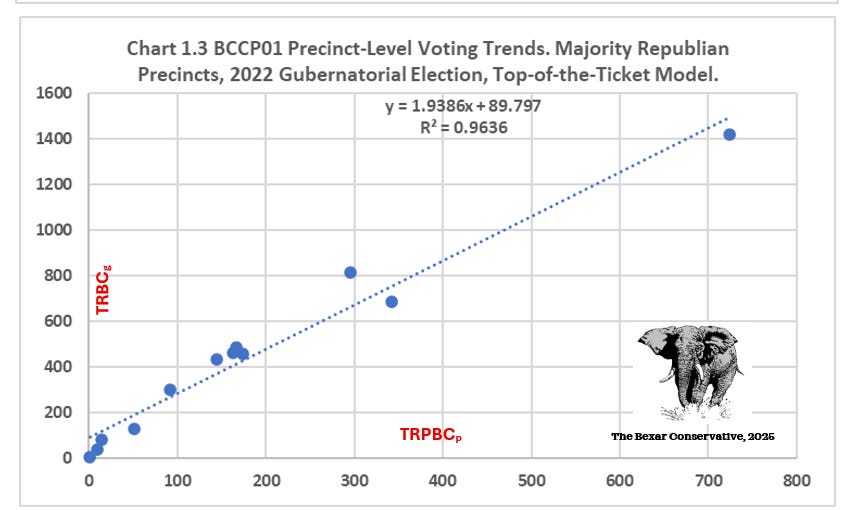
Both Charts 1.2 and 1.3 demonstrate the performance of Republican Occupied Precincts (ROP) and Majority Republican Precincts (MRP) in BCCP01, respectfully. R2 for each is excellent and visually tracks overall TRBCg performance, that is, the higher TRPBCp, the higher TRBCg. They affirm the strong relationship between TRPBCp and TRBCg. However, readers will note the decline in slopes. These smaller slopes show Republicans in these sub-sample failed to convert primary performance into general election performance as efficiently.
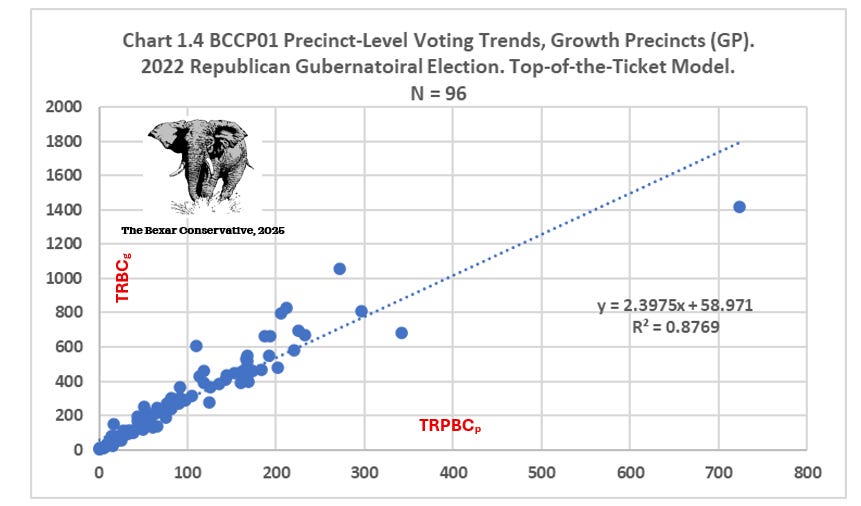
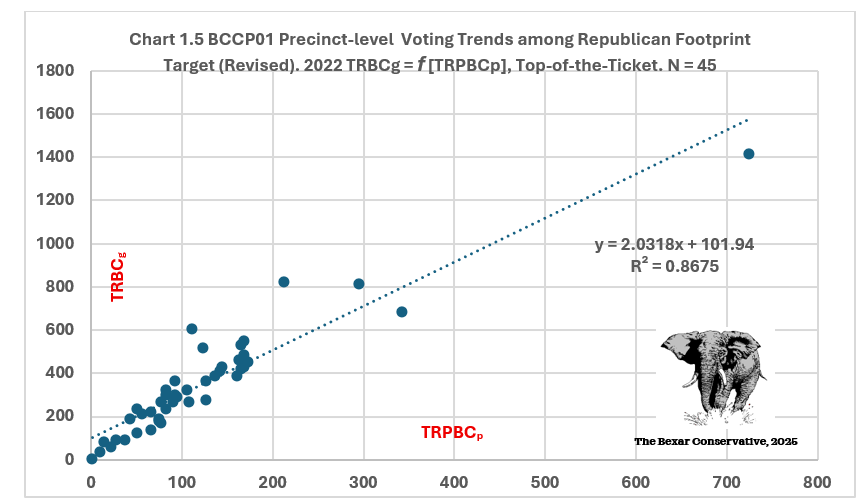
Charts 1.4 and 1.5 continue our examination of sub sample trends in BCCP01. Both confirm our findings to this point; there is a very strong relationship between primary elections data (participation) and general elections data. R2 for both sub samples are excellent and their slopes show a higher level of conversion than the previous two samples. Growth Precincts (GP) demonstrate the strongest level of conversion among the sub samples while the Republican Footprint Target sample, derived from general election analysis, also shows a stronger conversion rate than either ROPs or MRPs. This sample includes Majority Republican Precincts – DeBerry wins – aggregated with the 38 ROPs. This is a measure of the Republican Footprint in the district. This model continues to show the strong relationship between primary and general election data, demonstrates an excellent R2 (correlation coefficient), and improves on the slope (conversion rate).
Charts 1.6 and 1.7 show strong voting alignment across both the Urban Coalition (UrbanGOP)and Rural Suburban Coalition (RSCGOP) in Bexar County Commissioner Precinct 01 (BCCP01), but they also reveal structural differences as well.
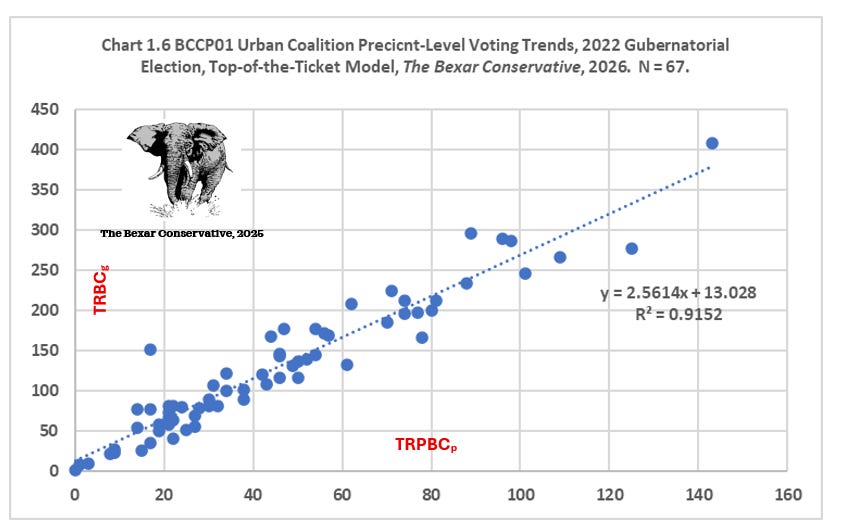
Urban Coalition precincts: The UrbanGOP sample consists of 67 precincts, all situated within Loop 410. The Republican vote (TRBCg) demonstrates consistency and exhibits limited variation. The regression analysis is presented as an evaluation between TRBCg as a function of TRPBCp , e.g.,
TRBCg, UrbanGOP = f(TRPBCp, UrbanGOP). UrbanGOP sample N = 67 precincts.
The model represents the Top-of-the-Ticket Republican vote share (Abbott) for 2022. The correlation is strong (R² ≈ 0.92), suggesting urban precincts display predictable and uniform voting patterns. Historically, these “…predictable and uniform voting patterns…” means predictably low Republican voter share in Socialist dominant urban precincts. The slope (= 2.56) would suggest robust Republican upside scaling, but the reality is higher yields occur in a very narrow spectrum. These data reveal minimal outliers; however, dispersion grows wider at higher vote levels. This behavior underscores the presence of a disciplined and cohesive urban voting bloc. That urban voter bloc is dominated and dictated by socialists. (See more below).
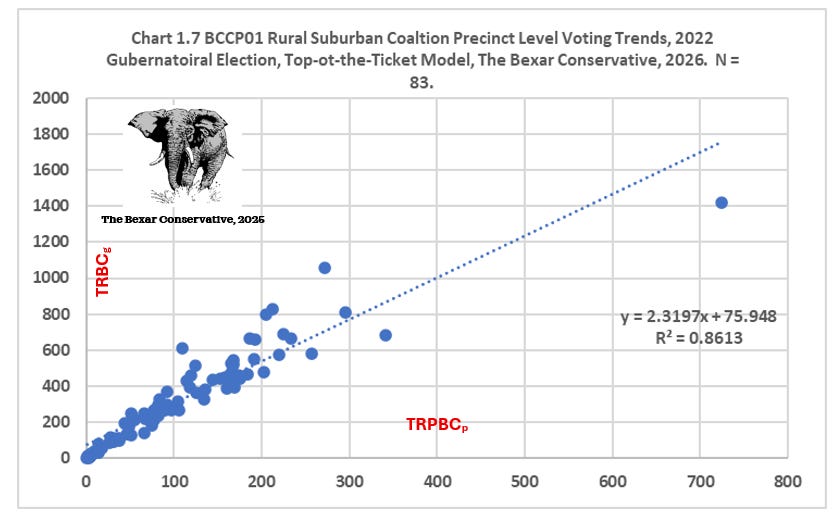
Rural–Suburban Coalition precincts (RSCGOP): sub sample size equals 83, all these precincts lie outside Loop 410. This sample could be further divided into Rural and Suburban; however, at this time we will keep the sample as defined at this time. The precincts making up the Rural Suburban Coalition sample display greater heterogeneity (a big word for assortment). Regression analysis confirms a strong relationship (R² ≈ 0.86), e.g.
TRBCg, RSCGOP = f (TRPBCp, RSCGOP)
The RSCGOP sample is visibly weaker than the UrbanGOP sample. This sample reflects more variation in how top-of-the-ticket voters perform. The slightly flatter slope (≈ 2.32) indicates marginally lower efficiency in converting modeled support into raw votes, while the much broader spread—especially at higher values—points to uneven turnout dynamics and coalition elasticity. A small number of high-vote outliers, e.g., 1144, exert disproportionate influence, suggesting that localized factors play a larger role in rural and suburban contexts.
THE END.