ALL DATA FOR 20230506, THE 6 MAY 023 ELECTION, ARE A FORECAST.
This post presents analyses and forecasts for the upcoming City of San Antonio (CoSA) Municipal elections. The analyses present a historical look at election performance from 1995 through 2021 with a forecast for 2023 (some analyses will vary as to the time-period).
Total registered voters in Bexar County (TRV- BC) are about 1.2 million at this writing. This number reflects population growth in the Bexar Region over the past quarter century.
Chart 1. Total Registered Voters in Bexar County with Comparisons to the City of San Antonio and areas Outside - CoSA, 1995 through MRD.

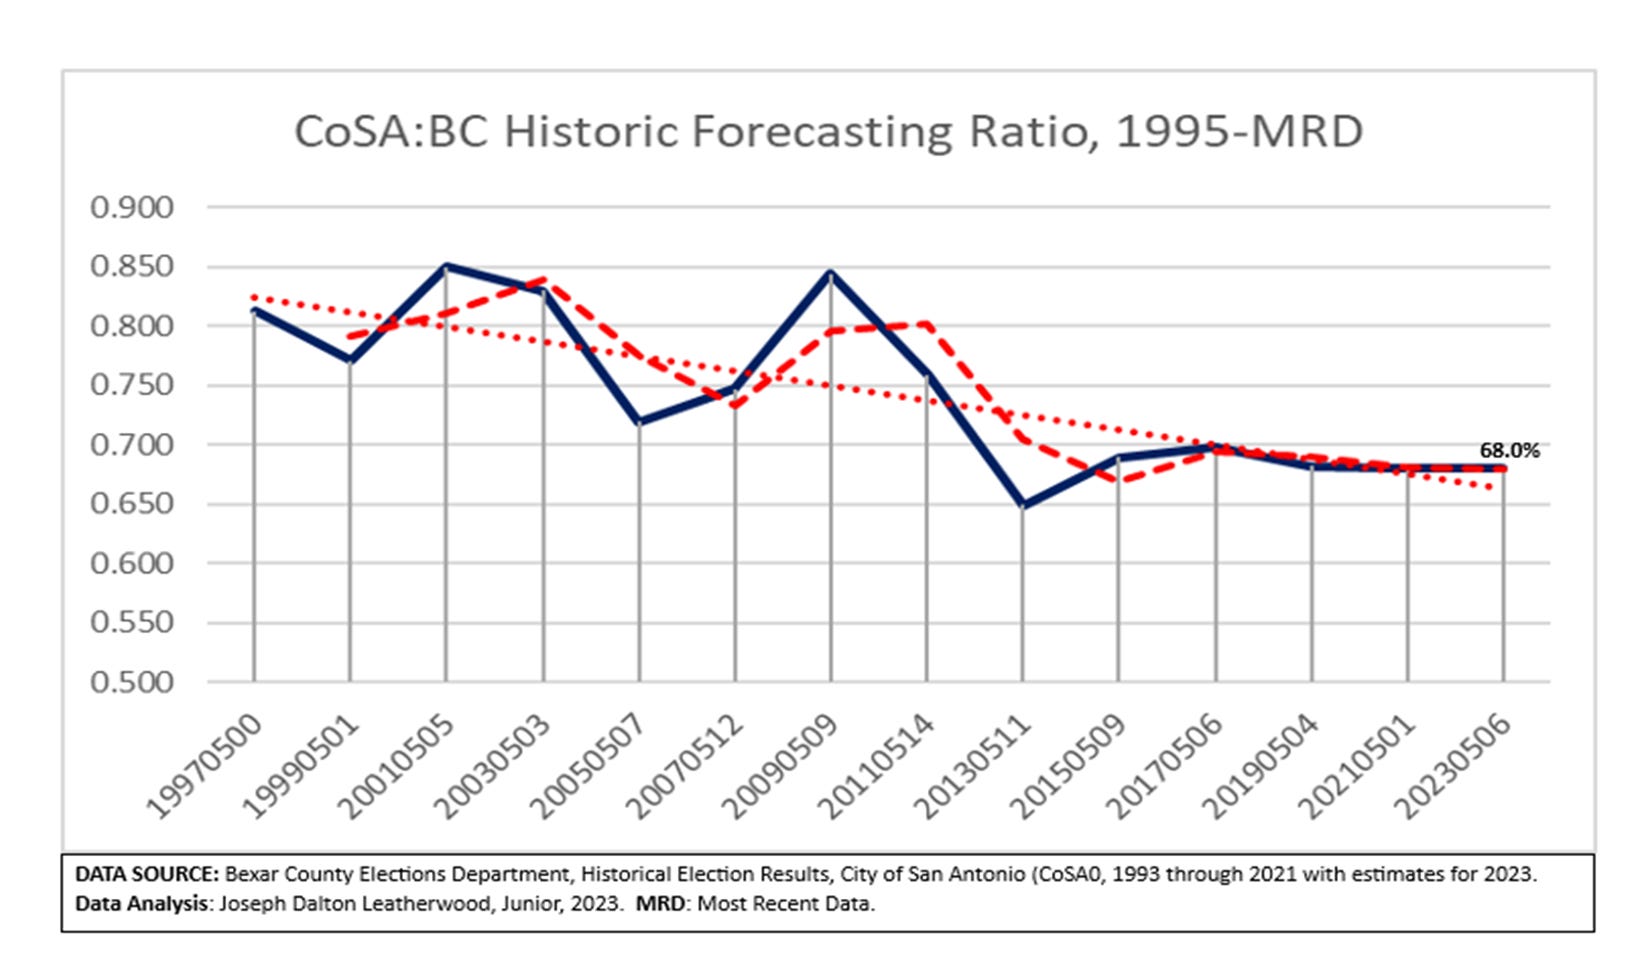
Total registered voters in the City of San Antonio (CoSA) make up about 2/3s of the total voters in the County. This comparison can be seen in the growing spread between TRV-BC and TRV - CoSA (Chart 1). The ratio between total registered voters in CoSA and total registered voters in BC has declined steadily over the period from 80+ percent in the 1990s to 68% in 2021 (See Chart 2).
Chart 2. Ratio of Total Registered Voters in CoSA to Total Registered Voters in Bexar County, 1995 through MRD.
This trend is confirmed by tracking the ratio of total registered voters in the City of San Antonio to total registered voters living outside the City of San Antonio (O-CoSA). Chart 3 shows this ratio has declined steadily.
In the 1990s, there were 5.9 voters registered within the CoSA per voter (1) living outside (O-CoSA). Today, that ratio is 2.1 registered voters within CoSA per voter (1) living outside (O-CoSA).
Chart 3. Ratio of Total Registered Voters in CoSA to Total Registered Voters Outside the City of San Antonio (O-CoSA), 1995 through MRD.

These data clearly demonstrate growth outside the City of San Antonio outpaces growth within. It is not surprising citizens flee high taxes, rising crime, socialist politics, government overreach and mismanagement, and growing congestion. Newcomers to the area or those looking to move out of the city are purchasing or building homes in the countryside to avoid the incumbrances as much as possible.
The general trend in the County is people moving from the center of the CoSA outward into the countryside (See Chart 4 below).
The sad reality is, the once great “Little Big Town” has turned into a sprawling, mismanaged metropolis more akin to Houston, dominated by extremist socialists.
Just consider since 2019, EMS/Fire Response time has slowed, violent crime is up 47%, assaults are up 30%, rapes are up 64%, and murder is up a staggering 340%. Is it little wonder, people are fleeing this “utopian” city?
Chart 4. Growth Comparisons of Total Registered Voters in Bexar County to Growth in the City of San Antonio (CoSA) and Areas Outside - CoSA, 1995 through MRD.

Contrasting these populations, the percentage change in Total Registered Voters within CoSA from 1997 to 2021 increased by 31.4%; the same measure for registered voters outside the CoSA exploded by some 240.8%.
But to put that in perspective, CoSA has 582 precincts or 75% of all the precincts in Bexar County. And in 2022, those who cast ballots in CoSA voted 61.5% for O’Rourke while in the hinterlands (O-CoSA), he garnered only 49.1%.
We are forecasting the number of total registered voters (TRV) in the City of San Antonio will be 812,000. Like all forecast, this is the mean forecast, and we believe TRV could be as high as 870,000. For this forecast, we are working from the mean forecast.
Chart 5. Total Registered Voters in the City of San Antonio (CoSA), 1997 through MRD.

These data demonstrate three historic trends at work. First, the secular growth in population within the CoSA. Second, the aggressive expansion of the CoSA city limits shown by the steep upswings (1997-2001 and 2005-2009). The upswing since 2013 has been principally from population growth (normal growth + in-migration). Thirdly, as Chart 2 made obvious, the declining proportion of CoSA voters show people fleeing the city and those moving in choosing to live in the countryside.
Unfortunately, in CoSA elections, turnout among its citizens is not good, though it has improved over the years. Chart 6 tracks turnout over time from 1995 through most recent data. The historical turnout (average) is 11.7%, although over the past four municipal elections, the turnout has moved above trend (historical average).
Chart 6. Total Ballots Cast (Votes) in CoSA Elections, 1995 through MRD.

The mean forecast for turnout is 18.5%. The forecast range is as high as 20.6% or as low as 16.4%.
The 2021 CoSA Municipal Election was a historical turnout. In that election, the forces of Law and Order, Rule of Law, and Law Enforcement were pitted against the anti-Law and Order, anti-Rule of Law, and anti-Law Enforcement forces. In most city council races and the mayor’s race, challengers stood up against Prop B seeking to overturn the council.
Prop B was the central driver for the 2021 election. It was an extremist proposition calling for defunding police and other proposals hamstringing law enforcement. The vote on the proposition was the largest vote getter, larger than the vote for mayor or city councilmembers (when combined). Prop B drew large numbers, and it was defeated, barely.
The 2021 election while beating back the extremist impulse with respect to the rule of law; nonetheless saw the election of the most extreme socialist city council in history, which in many ways completely undermined the 2021 vote for the Rule of Law.
Presently, CoSA is gripped in another of these battles between extremism and common sense, this time it is called Prop A and it seeks to make the streets safer by hamstringing law enforcement, legalizing vandalism, setting minimum thresholds for theft ($), no record (charges) for some crimes, and appointment of an “Equity or Justice Czar” in charge of “justice” issues, including the police department.
Like Prop B in 2021, Prop A will drive the turnout promoting votes against the measure. TBC’s forecast for turnout is between 16.4% and 20.6% with a mean turnout forecast of 18.5%.
Chart 7 tracks the total number of ballots cast in each CoSA Municipal Election since 1997. The historical average for total ballots cast is 85,503. This number will certainly be exceeded as it has been over the past four CoSA Municipal elections. The TBC forecast is between 133,947 and 167,431 ballots cast with a mean forecast of 150,469.
Chart 7. Total Ballots Cast (TBC) in the City of San Antonio (CoSA). 1997 through MRD.

While we believe Prop A will drive voting, we know from experience, the drop off from the top-of-the-ballot issue or candidate (mayor) is about 11.4% on average. That is, when the city council races are aggregated, they receive on average 11.4% fewer votes than the top-of-the-ballot (or issue).
Table 1. CoSA Municipal Election Forecast Table.

Most recent polling indicates the vote on Prop A will be close and we must reach out to our family, friends, and neighbors to turn out and vote against this monstrosity. We cannot defeat this atrocious proposition unless we turnout the vote and vote ourselves.